
Creator analytics for your store
Review revenue, sales, customers, traffic sources, and the visitor funnel from your CreatorStore dashboard. Use the data to see which products and pages are getting attention and where purchases come from.
- Store performance and product-level metrics
- Visitor funnel, traffic sources, and top pages
- Customer and purchase data in dedicated views
Review store performance from four dashboard views
Use Analytics for store performance, Visitor Journey for traffic and conversion steps, Customers for buyer records, and Income for purchase details.
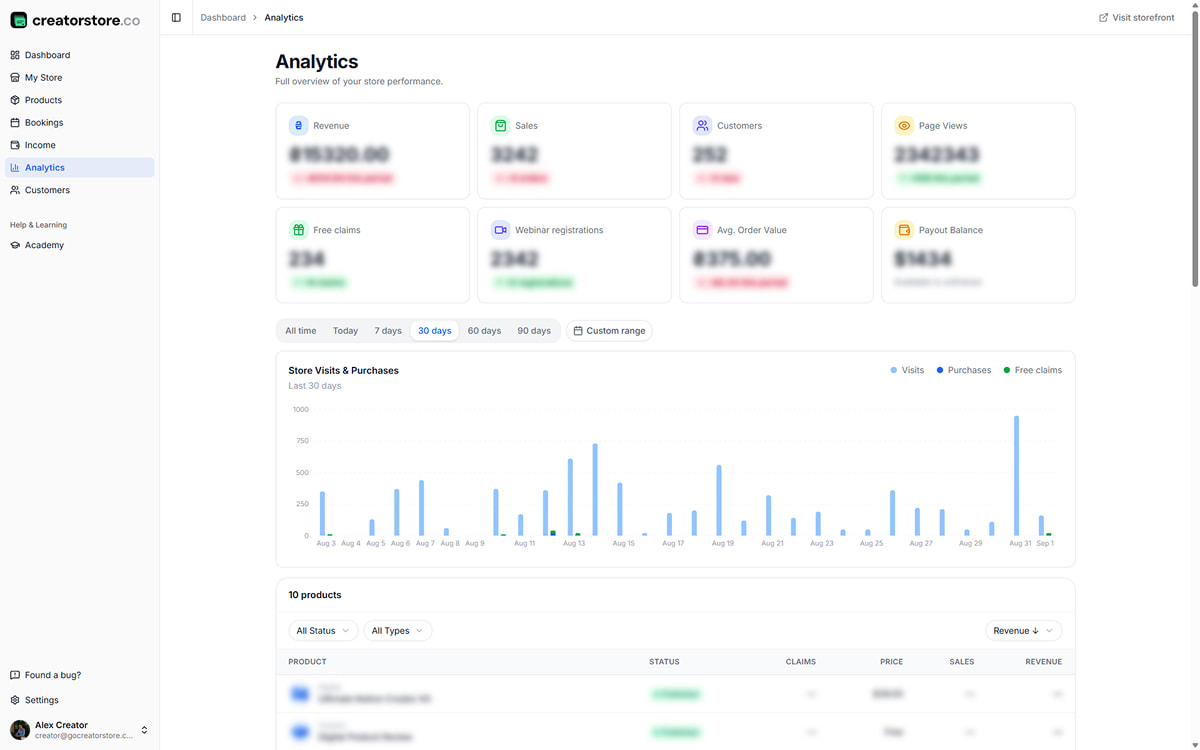
See revenue, sales, and traffic in one screen
See revenue, sales, customers, page views, free claims, average order value, payout information, and the Store Visits & Purchases chart. Use the available time filters to review different periods.
- Store performance cards and trend indicators
- Store Visits & Purchases chart
- Time filters for reviewing different periods
- Product-level performance breakdown
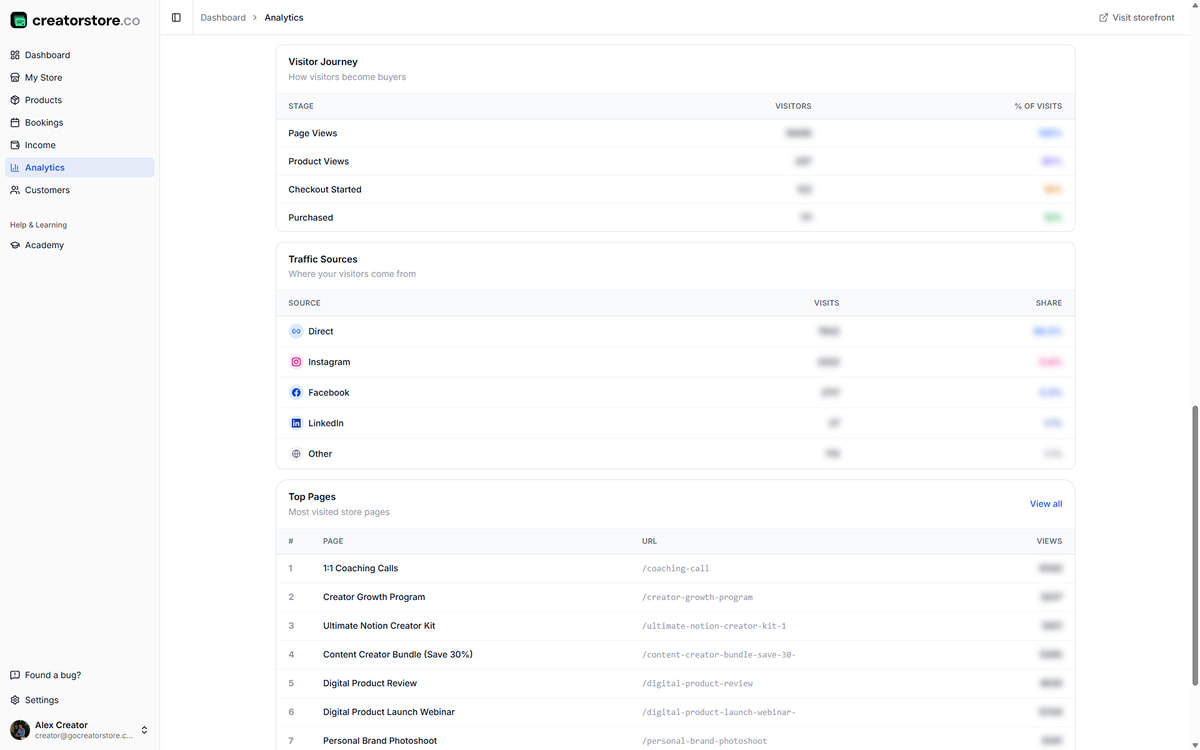
Where visitors come from and how they convert
Visitor Journey shows the path from page view to product view, checkout start, and purchase. Traffic Sources shows where visits are attributed, while Top Pages highlights the pages receiving the most views.
- Visitor Journey funnel with drop-off percentages
- Traffic Sources: Direct, Instagram, Facebook, LinkedIn, and more
- Top Pages: which pages get the most views
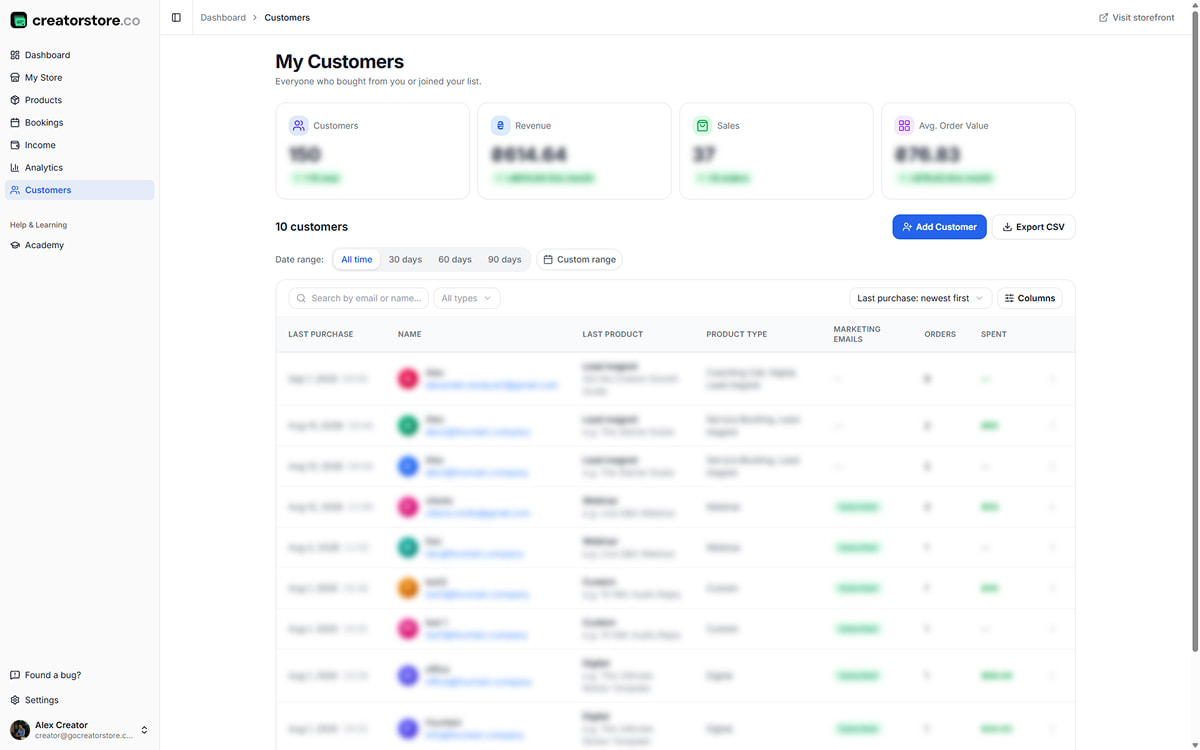
Every buyer and every order in one place
Use the Customers view to review buyer details and purchase activity recorded in CreatorStore. Search and filtering options help you find the customer or order information you need.
- Customer and purchase details
- Search and available filters
- Order history connected to customer records
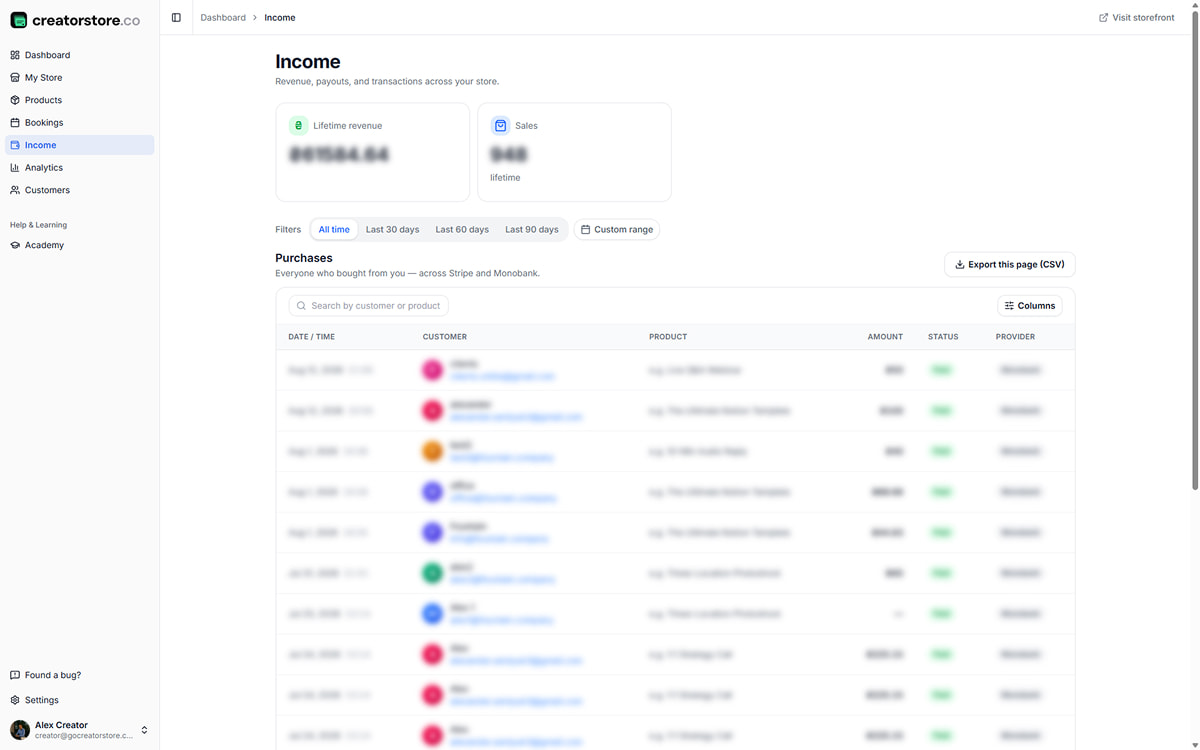
Every transaction across Stripe and PayPal
Use the Income view to review purchases with details such as date, customer, product, amount, status, and payment provider where available.
- Purchase details in one table
- Date and search filters where available
- Payment provider shown with the transaction
Store metrics · Visitor journey · Traffic sources · Purchase data
Understand the main numbers behind your store
Review revenue, transactions, customers, traffic, free claims, webinar registrations, average order value, and payout information from the analytics area.
Revenue
Revenue recorded for the selected period.
Sales
Sales recorded for the selected period.
Customers
Customer activity recorded for the selected period.
Page Views + Trend
Page views and available trend information for the selected period.
Free claims
Free product or lead-magnet claims recorded for the selected period.
Webinar registrations
Registrations recorded for webinar offers.
Avg. Order Value
Average order value calculated from recorded revenue and sales.
Payout Balance
Payout information shown in the analytics area when available.
Analytics is built into your CreatorStore dashboard
CreatorStore records supported store activity for its built-in analytics. Open the dashboard to review the data available for your storefront.
Publish your store
Publish your storefront so supported store activity can appear in Analytics.
Add products
Published offers can be reviewed with the product performance information available in Analytics.
Share your link
Share your storefront and review the traffic-source information CreatorStore is able to record.
Open Analytics
Open Analytics to review the available store, traffic, customer, and purchase data.
What CreatorStore Analytics helps you review
Store analytics connects traffic and sales activity to the storefront where you sell. Instead of looking only at page views, you can review product activity, purchase steps, customers, and transaction data recorded by CreatorStore.
Follow the visitor journey
The Visitor Journey view helps you compare stages such as page views, product views, checkout starts, and purchases. Use the differences between stages to identify where visitors are leaving the purchase flow.
Compare products and pages
Product-level metrics and Top Pages help you see which offers are generating activity and which pages receive more views. Traffic Sources adds context about where recorded visits came from.
Review customers and purchases
Customer and Income views connect buyer records with purchase information available in CreatorStore, so you can review store activity without relying only on a general web-analytics report.
CreatorStore Analytics and Google Analytics
CreatorStore Analytics focuses on activity inside your CreatorStore, including storefront, product, customer, and purchase data. Google Analytics is a separate web-analytics product and can be useful when you need broader website or campaign analysis. The tools serve different purposes.
Creator analytics FAQ
Common questions about the analytics built into CreatorStore.
What can I track in CreatorStore Analytics?
Do I need Google Analytics to use CreatorStore Analytics?
Can I see the purchase funnel?
Can I see traffic sources and top pages?
Can I review performance by product?
Can I see customer information?
Can I review purchases in one place?
Is CreatorStore Analytics the same as Google Analytics?
Review your store performance in CreatorStore
Use built-in analytics to review store activity, products, traffic, customers, and purchases from your dashboard.
✓ 8 KPIs at a glance · ✓ Full conversion funnel · ✓ Zero setup · ✓ 14 days free